Tag
CDC
-
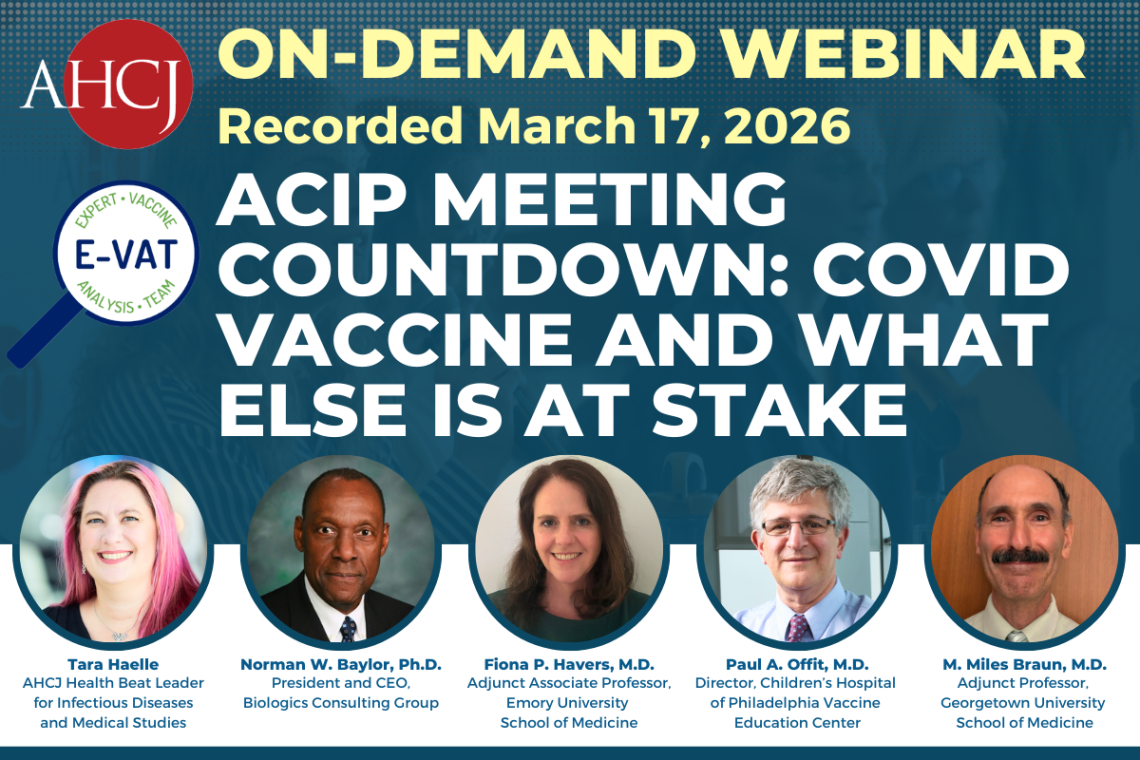
ACIP meeting countdown: COVID vaccine and what else is at stake
In this webinar, panelists discussed a federal judge’s breaking news ruling to halt multiple vaccine decisions made by RFK and…

-
•
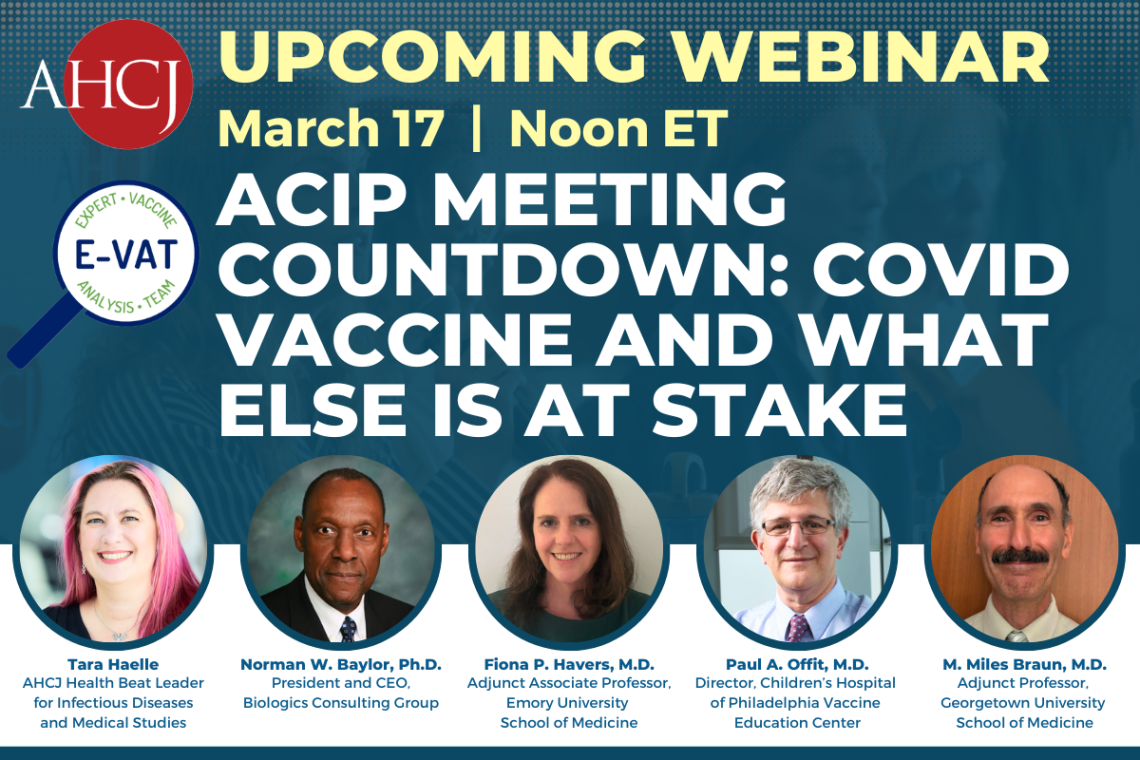
ACIP meeting countdown: COVID vaccine and what else is at stake
Don’t miss this opportunity to get up to speed before the March 18-19 CDC Advisory Committee on Immunization Practices (ACIP)…
-
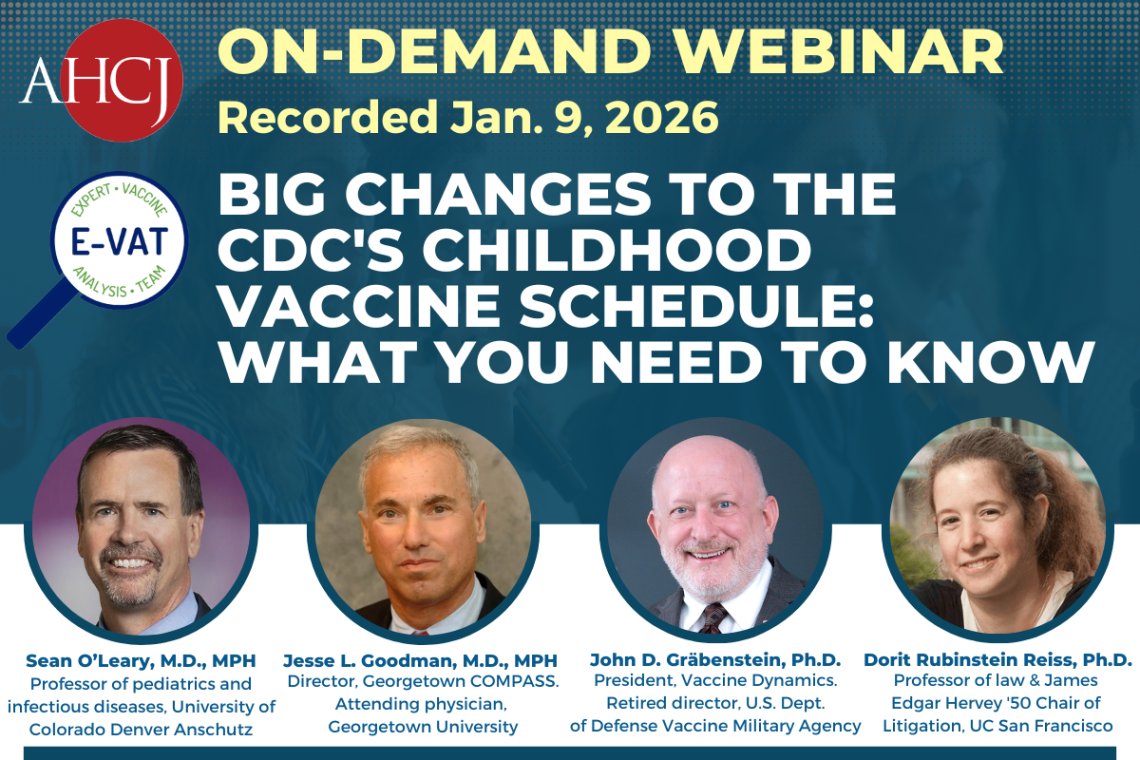
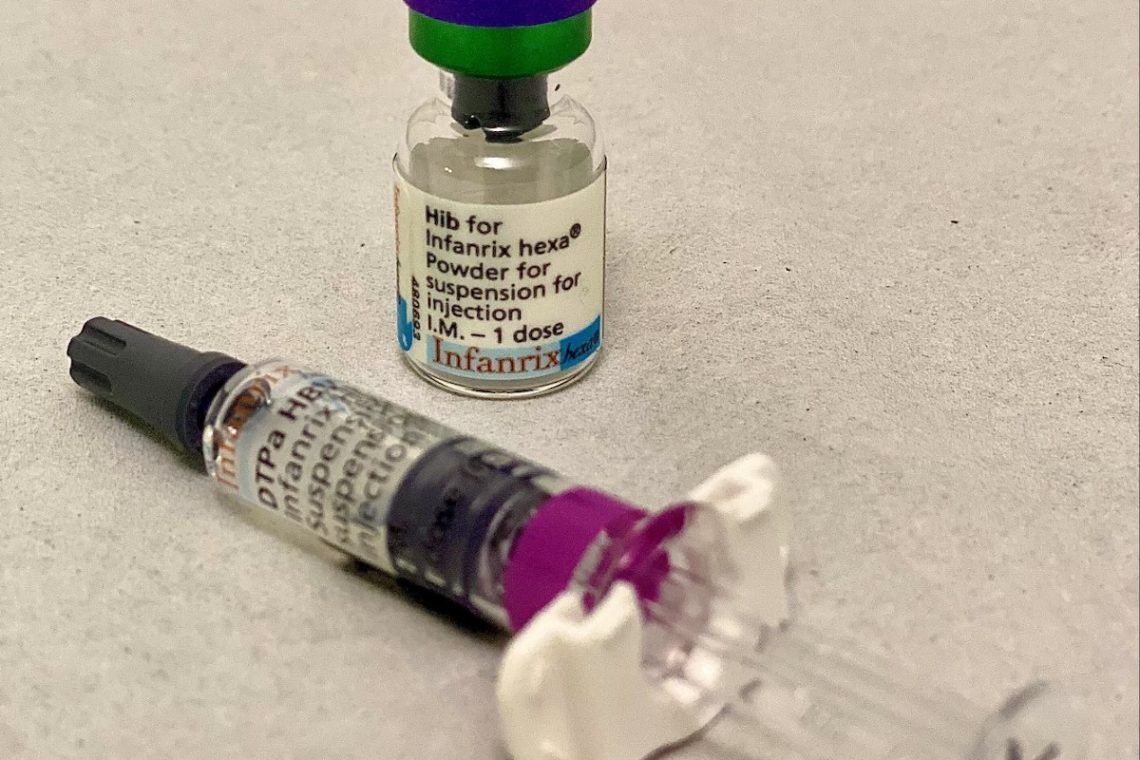
Big changes to the CDC’s childhood vaccine schedule: What you need to know
In this webinar, hear from the experts about the CDC’s decision to shift six immunizations off the recommended childhood vaccine…
-
Covering the big changes in the CDC’s recommended childhood vaccine schedule
The CDC has changed the national recommended children’s immunization schedule in opposition to evidence and major public health organizations.
-
•
Big changes to the CDC’s childhood vaccine schedule: What you need to know
This week, the CDC shifted six vaccines on the childhood vaccine schedule from “recommended” to “shared clinical decision-making.” Here’s what…

-
Why reporters should cover this week’s CDC meeting on hepatitis B vaccine and more
A CDC committee will discuss its current policy of universal hepatitis B vaccination at birth and other recommendations from Dec.…
-
Trust, public health reporting and the CDC: Insider perspectives
In this webinar, hear from former CDC officials on where to go for reliable reporting resources after the dismantling of…
-
•
Trust, public health reporting and the CDC: Insider perspectives
In this webinar, we’ll talk with former CDC officials on where to go for reliable reporting resources after the dismantling…
-

New institute to fill gap on oral infection guidance after CDC cuts
The new Institute of Dental Safety and Science aims to develop oral health guidance and infection mitigation recommendations now that…
-
Where to find accurate vaccine information amidst the CDC’s ongoing collapse
With the CDC no longer a trustworthy source, use these resources to find reliable, accurate, evidence-based information about vaccines and…