Tag
hospital compare
-

How are ACA’s quality measures affecting health care?
On a recent What the Health podcast, where I’m a frequent guest, we took some listeners’ questions. One was about…

-
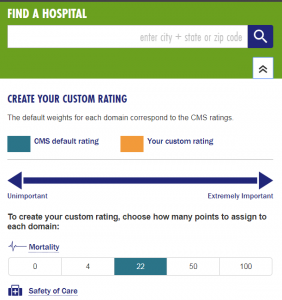
Report shows how hospital rating reports can meet patients’ needs more effectively
The federal Centers for Medicare and Medicaid Services launched the Hospital Compare website to let consumers evaluate hospital performance based…

-
•
Hospital Compare helps reporter fact check claims
After the local county commission voted to close Birmingham’s Cooper Green Mercy Hospital and replace it with a hub-and-spoke system…
-
•
Hospitals learning not to fear public data
In HealthLeaders magazine, a publication that targets “healthcare executives and senior decision-makers,” Cheryl Clark writes that the recent explosion of…
-

As consumers see more hospital ‘report cards,’ reporters can explain their limitations
At Health Journalism 2012, Harvard’s Ashish K. Jha, M.D., M.P.H., told attendees to watch for new hospital report cards from…
-
•
Disclosure of hospital infections still in its infancy
On Forbes.com, Gergana Koleva evaluated the woeful state of national hospital-associated infection reporting, with the help of recently published research.…
-
•
Ohio’s hospital transparency law under fire
Thanks are due to blogger and one-time hospital executive Paul Levy for drawing our attention to the Ohio hospital industry’s…
-
•
Dallas reporters use AHRQ data to measure patient safety
The Dallas Morning News continues its 19-month investigation into patient safety at UT Southwestern Medical Center and Parkland Memorial Hospital.…
-
•
Data shows disconnect between patient perception, hospital performance
Sifting through Medicare hospital rating data, USA Today reporters Steve Sternberg and Christopher Schnaars found an enlightening disconnect between patients’…
-
•
Data: Hospital performs ‘combination’ CT scans at 10 times national rate
Lisa Chedekel, of the Connecticut Health Investigative Team, used Hospital Compare data from the Centers for Medicare & Medicaid Services…